Attack Surface Monitoring
Proses monitoring untuk mendeteksi port yang terbuka, teknologi yang digunakan, subdomain yang teridentifikasi, SSL dan domain expiration, serta security headers pada target Anda.
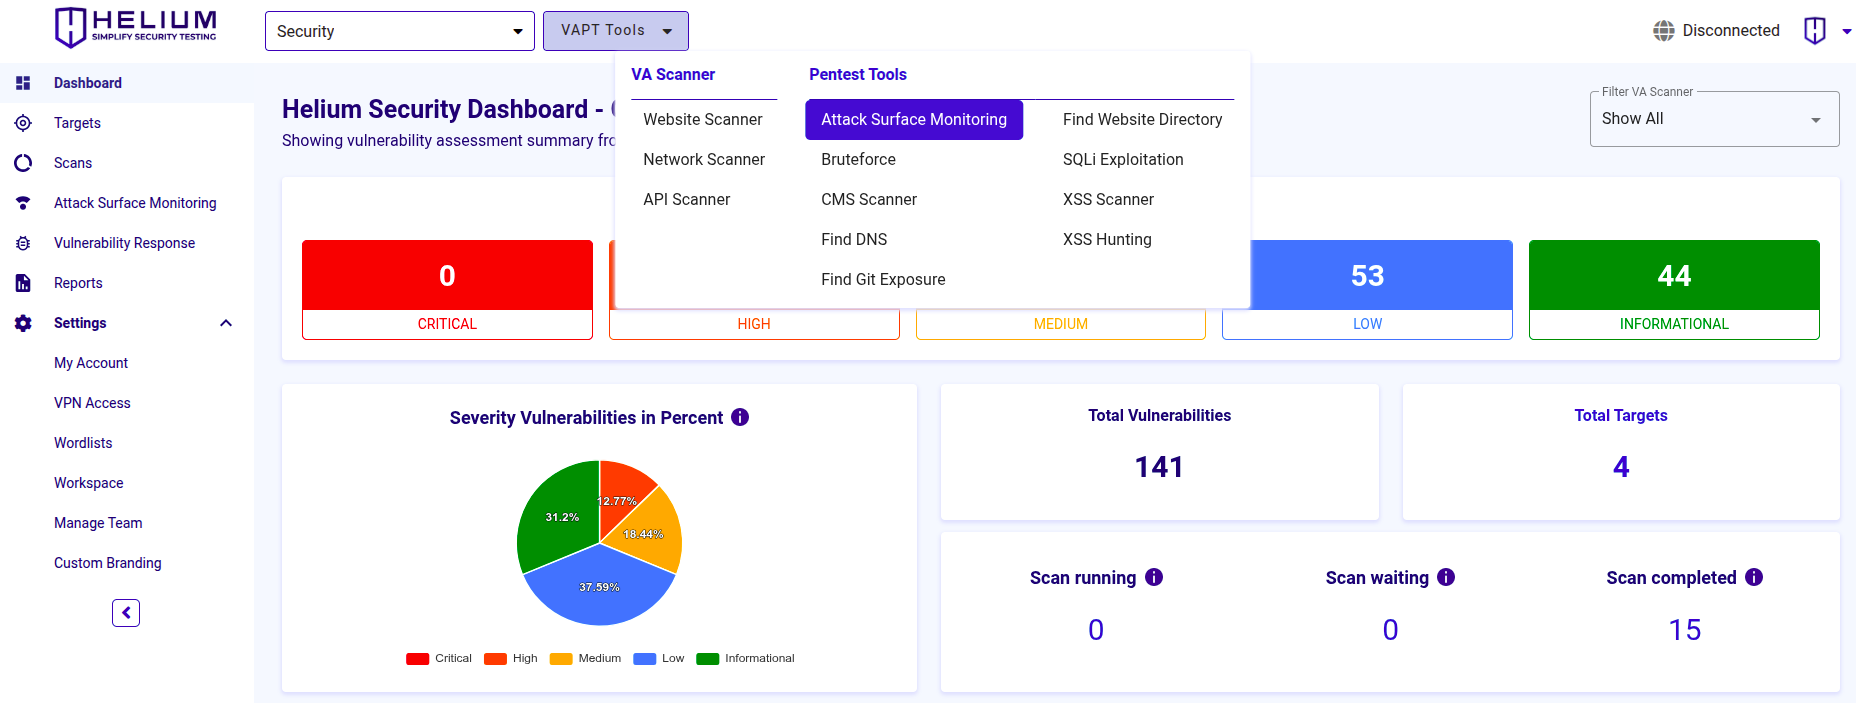
Akses Attack Surface Monitoring via Menu Navigasi
Pengguna dapat melakukan scan menggunakan pentest Tools melalui menu navigasi "VAPT Tools". Dengan mengklik menu "VAPT Tools", berbagai tool akan muncul, kemudian klik tool Attack Surface Monitoring.
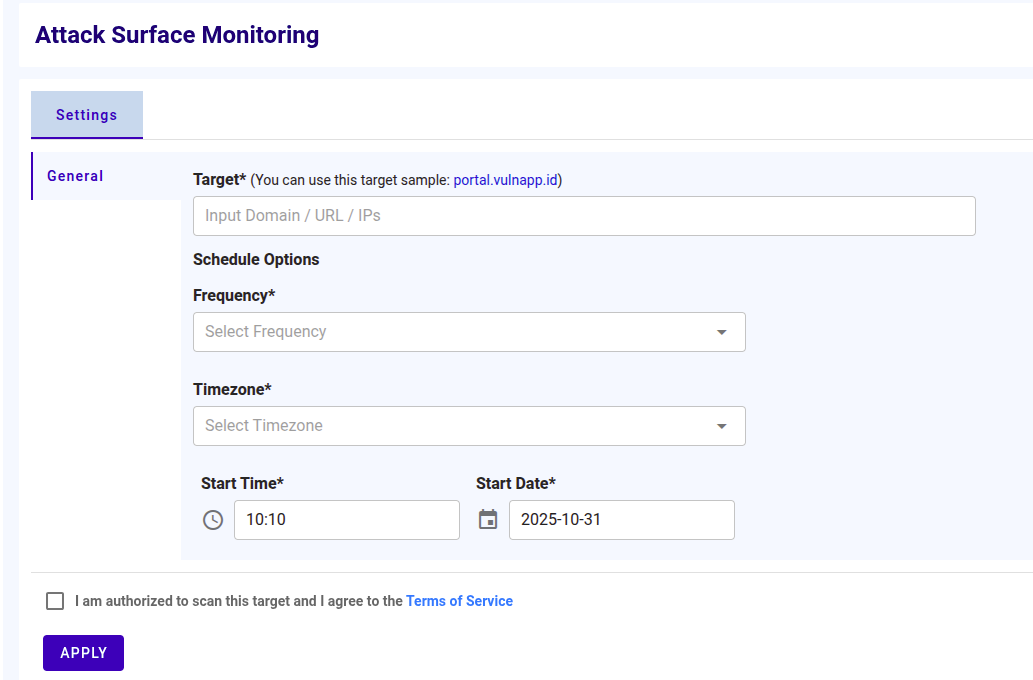
Untuk menjadwalkan monitoring Attack Surface, ikuti langkah-langkah berikut
- Masukkan nilai target berupa domain, URL, atau IP(s) ke dalam textbox Target
- Pilih frekuensi, waktu, zona waktu, dan jam yang akan digunakan untuk menjadwalkan monitoring
- Klik Apply untuk memulai scan awal, scan berikutnya akan berjalan sesuai dengan jadwal yang dikonfigurasi
Akses Attack Surface Monitoring Via Halaman Targets
Target yang dipilih akan di-scan menggunakan Attack Surface Monitoring. Pilih tool Attack Surface Monitoring.

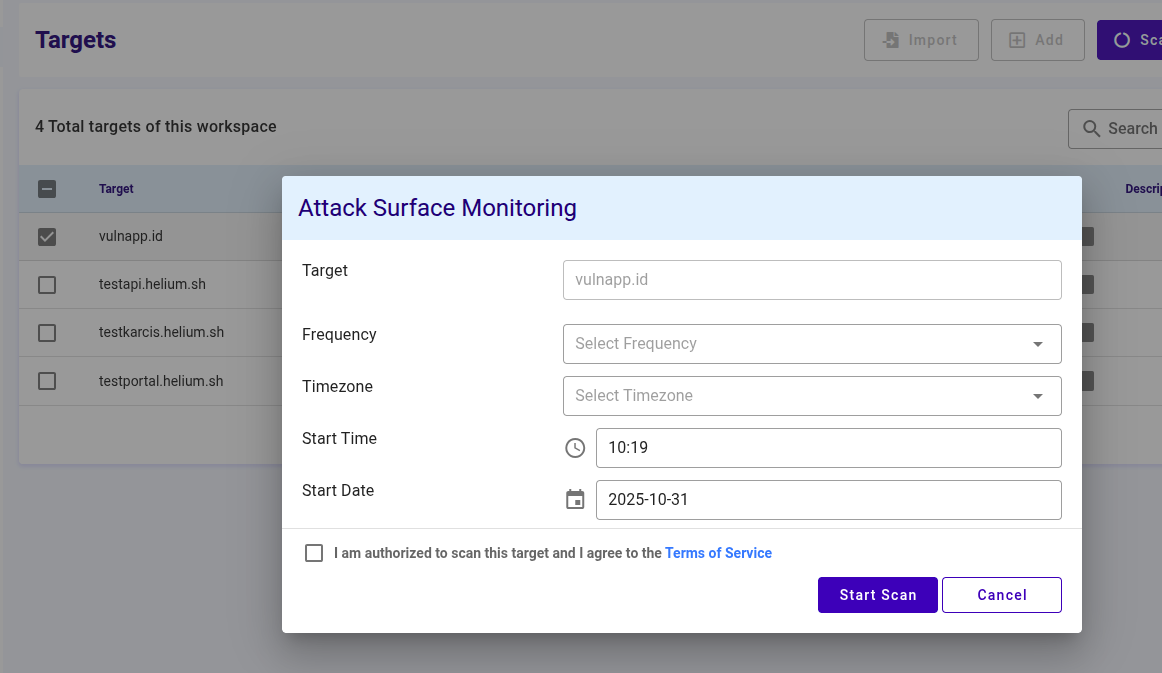
Untuk menjadwalkan monitoring Attack Surface, ikuti langkah-langkah berikut
- Pilih frekuensi, waktu, zona waktu, dan jam yang akan digunakan untuk menjadwalkan monitoring
- Klik Apply untuk memulai scan awal, scan berikutnya akan berjalan sesuai dengan jadwal yang dikonfigurasi
Dashboard Attack Surface Monitoring
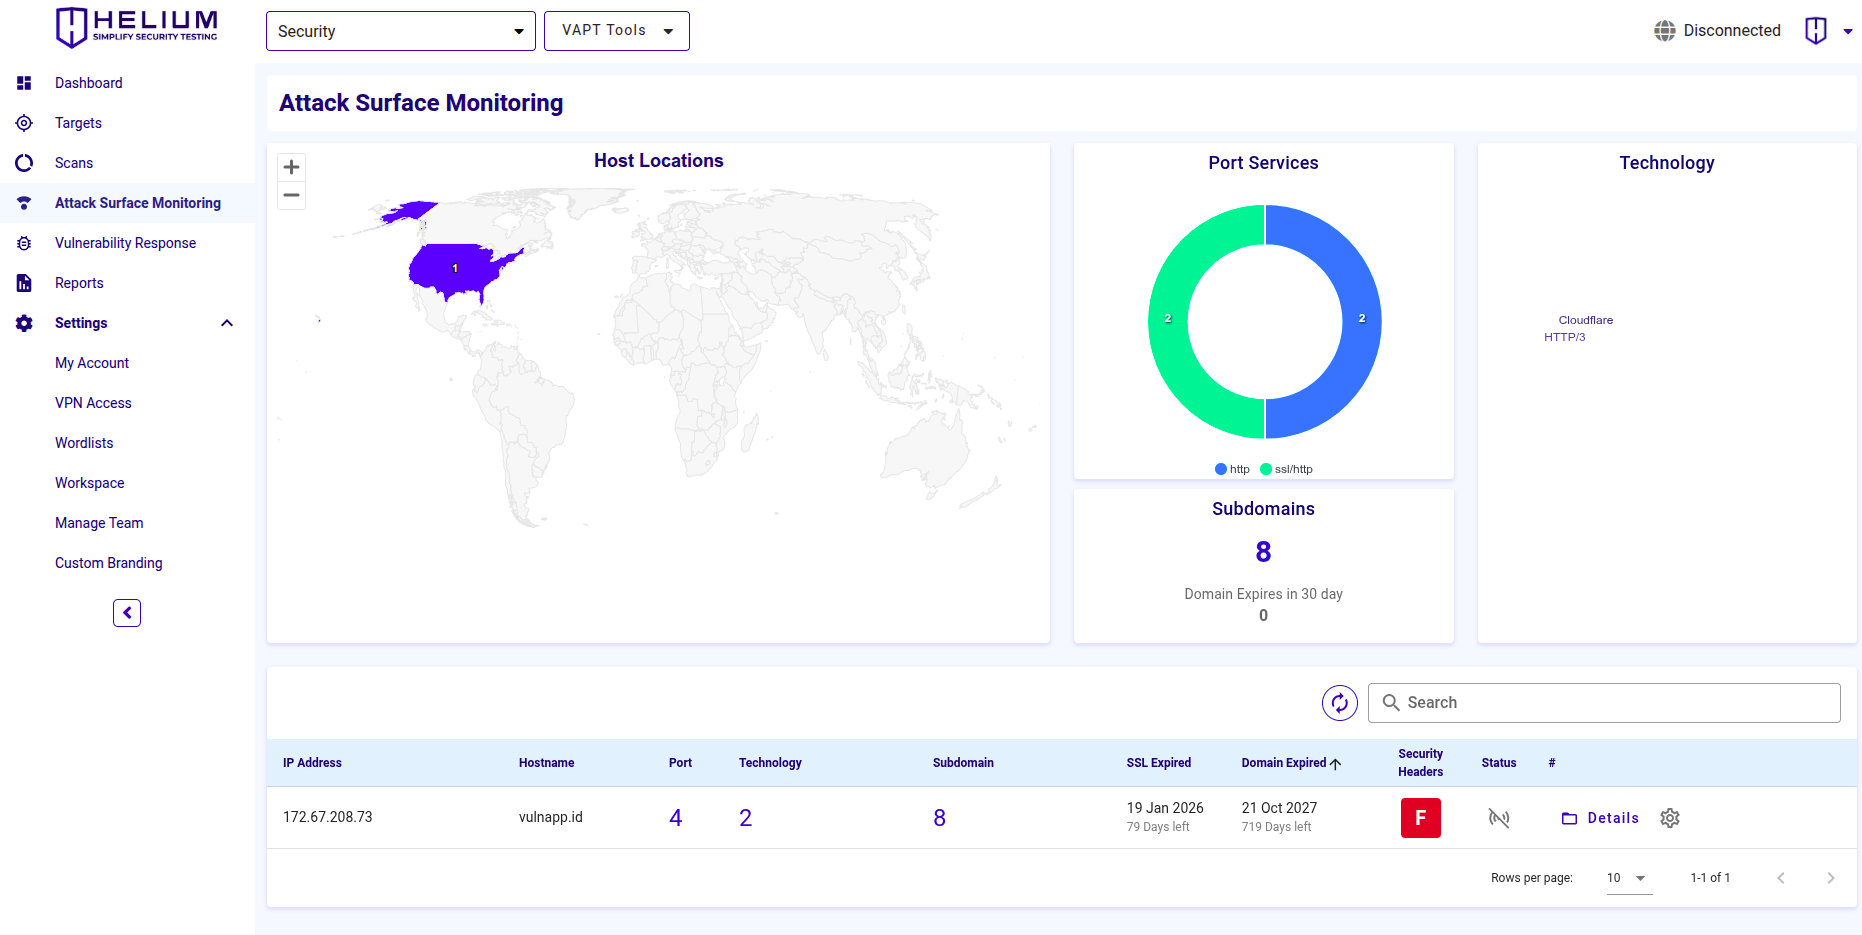 Dashboard menyediakan gambaran umum tentang aset yang terdeteksi dan postur keamanannya. Ini mencakup
- Host Locations: Peta dunia yang menyoroti lokasi host berada
- Port Services: Grafik melingkar yang menampilkan port layanan yang terbuka (misalnya, HTTP, SSH, SMTP)
- Technology: Word cloud yang menampilkan teknologi yang terdeteksi (misalnya, Nginx, Ubuntu, Bootstrap)
- Subdomains: Bagian yang menunjukkan bahwa tidak ada data subdomain yang tersedia saat ini
- Asset Table: Mencantumkan detail seperti alamat IP, hostname, jumlah port yang terbuka, teknologi yang digunakan, tanggal kedaluwarsa SSL dan domain, serta nilai security header
Interface ini membantu pengguna memantau attack surface eksternal mereka, mendeteksi layanan yang terekspos, dan mengelola kerentanan potensial.
Klik ikon status untuk melihat jadwal monitoring, dan klik ikon gear untuk memulai atau menghentikan monitoring.

Anda dapat melihat informasi lebih lanjut dengan mengklik tombol Details.
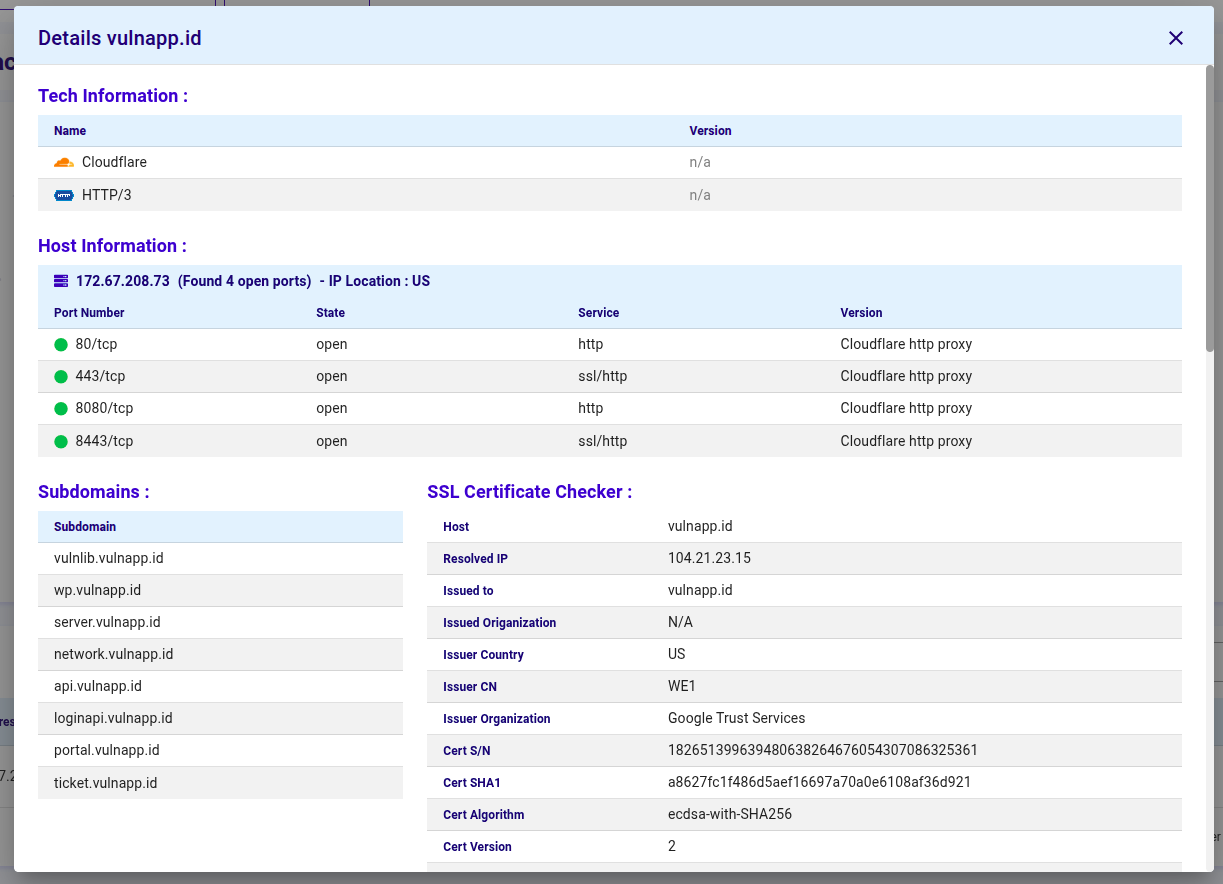

- Tech Information : Mencantumkan teknologi yang terdeteksi dan versinya (misalnya, web server, CDN, HTTP/3) yang digunakan oleh target
- Host Information : Menampilkan IP yang terselesaikan, port dan layanan yang terbuka dengan status dan versi layanan yang terdeteksi
- Subdomains : Menghitung subdomain yang ditemukan untuk domain target (berguna untuk pemetaan attack-surface yang diperluas)
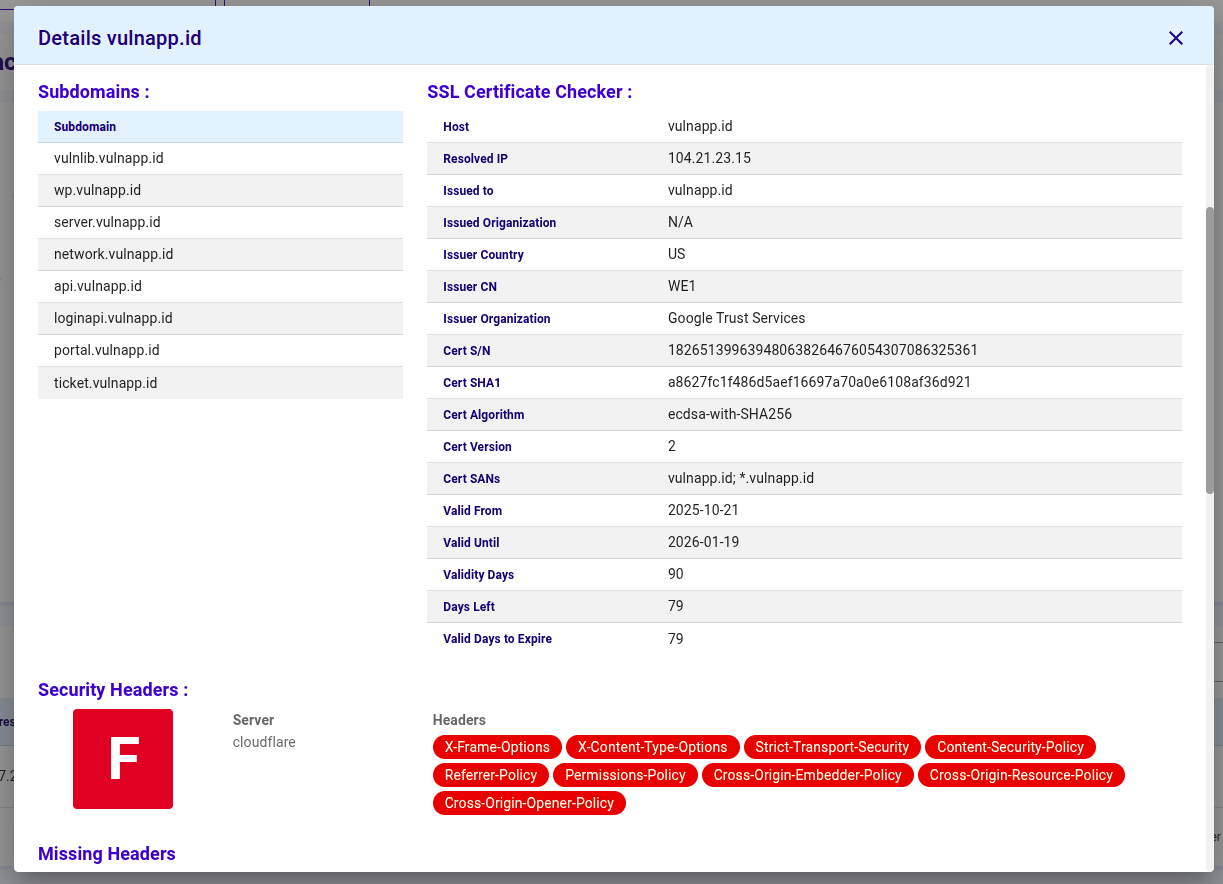
- SSL Certificate Checker : Merangkum detail sertifikat: SANs, issuer, periode validitas, fingerprint dan algoritma
- Security Headers : Mencantumkan HTTP security headers yang hilang atau ada beserta status/nilainya (CSP, HSTS, X-Frame-Options, dll.)
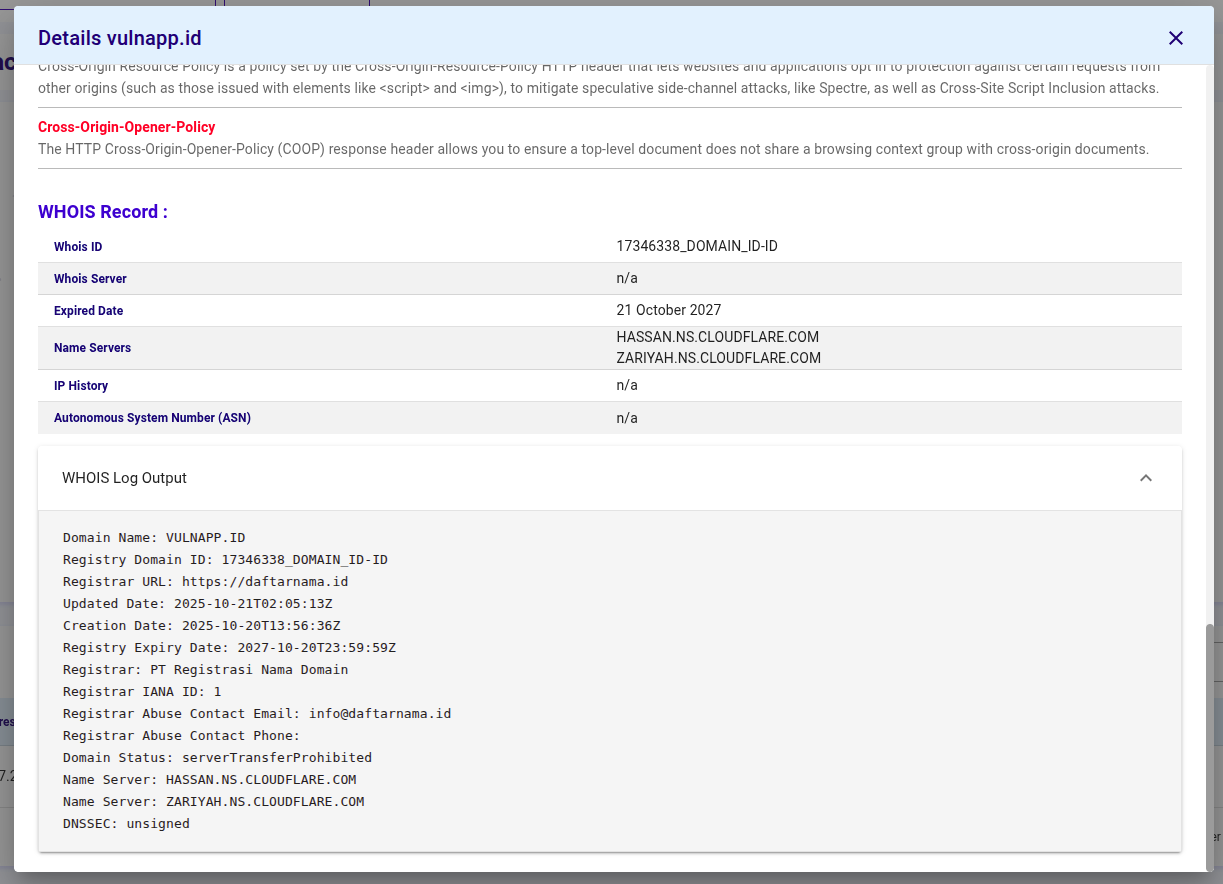
- WHOIS Record : Menampilkan metadata pendaftaran domain: registrar, tanggal pembuatan/kedaluwarsa, name servers dan info kontak