Attack Surface Monitoring
Monitoring process to detect open ports, technologies used, identified subdomains, SSL and domain expiration, and security headers on your target.
The selected target will be scanned using Attack Surface Monitoring. Select the Attack Surface Monitoring tool.
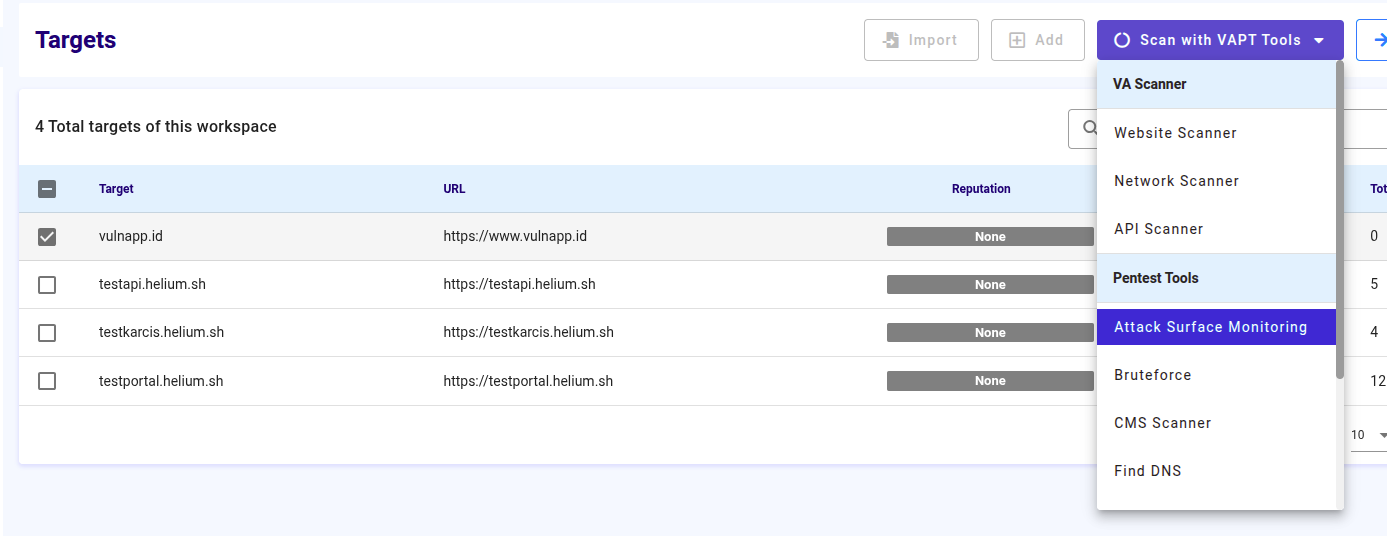
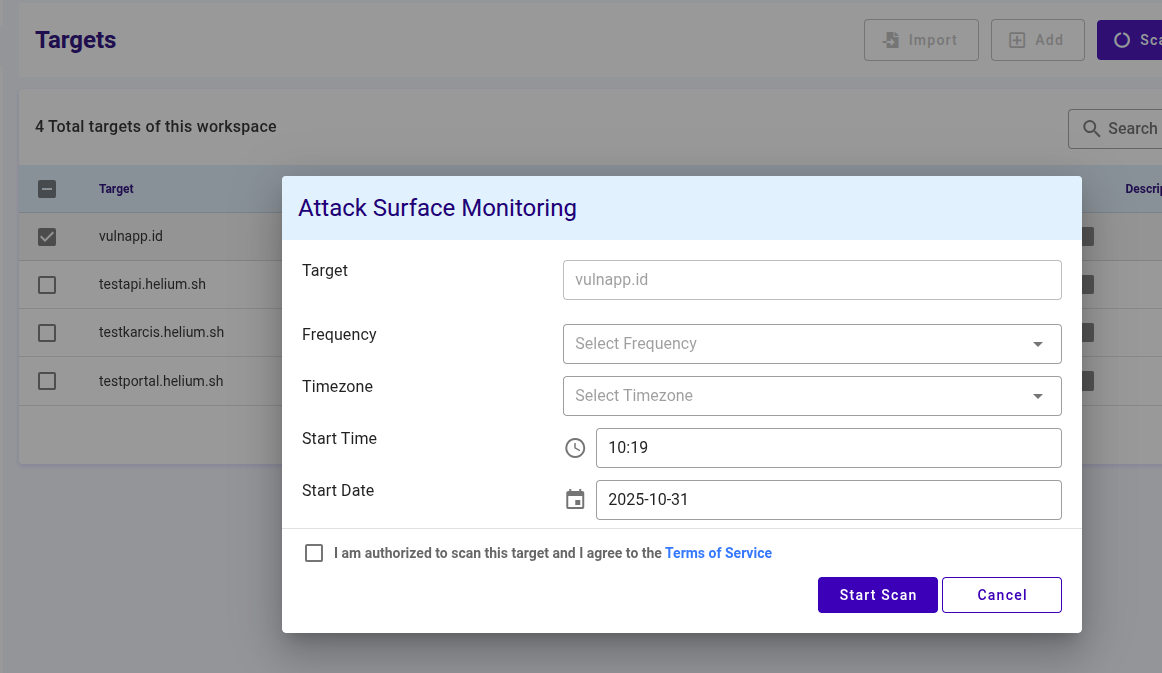
To schedule Attack Surface monitoring, follow these steps
- Select the frequency, time, time zone, and hour to use for scheduling the monitoring
- Click Apply to start the initial scan, subsequent scans will run according to the configured schedule
Attack Surface Monitoring Dashboard
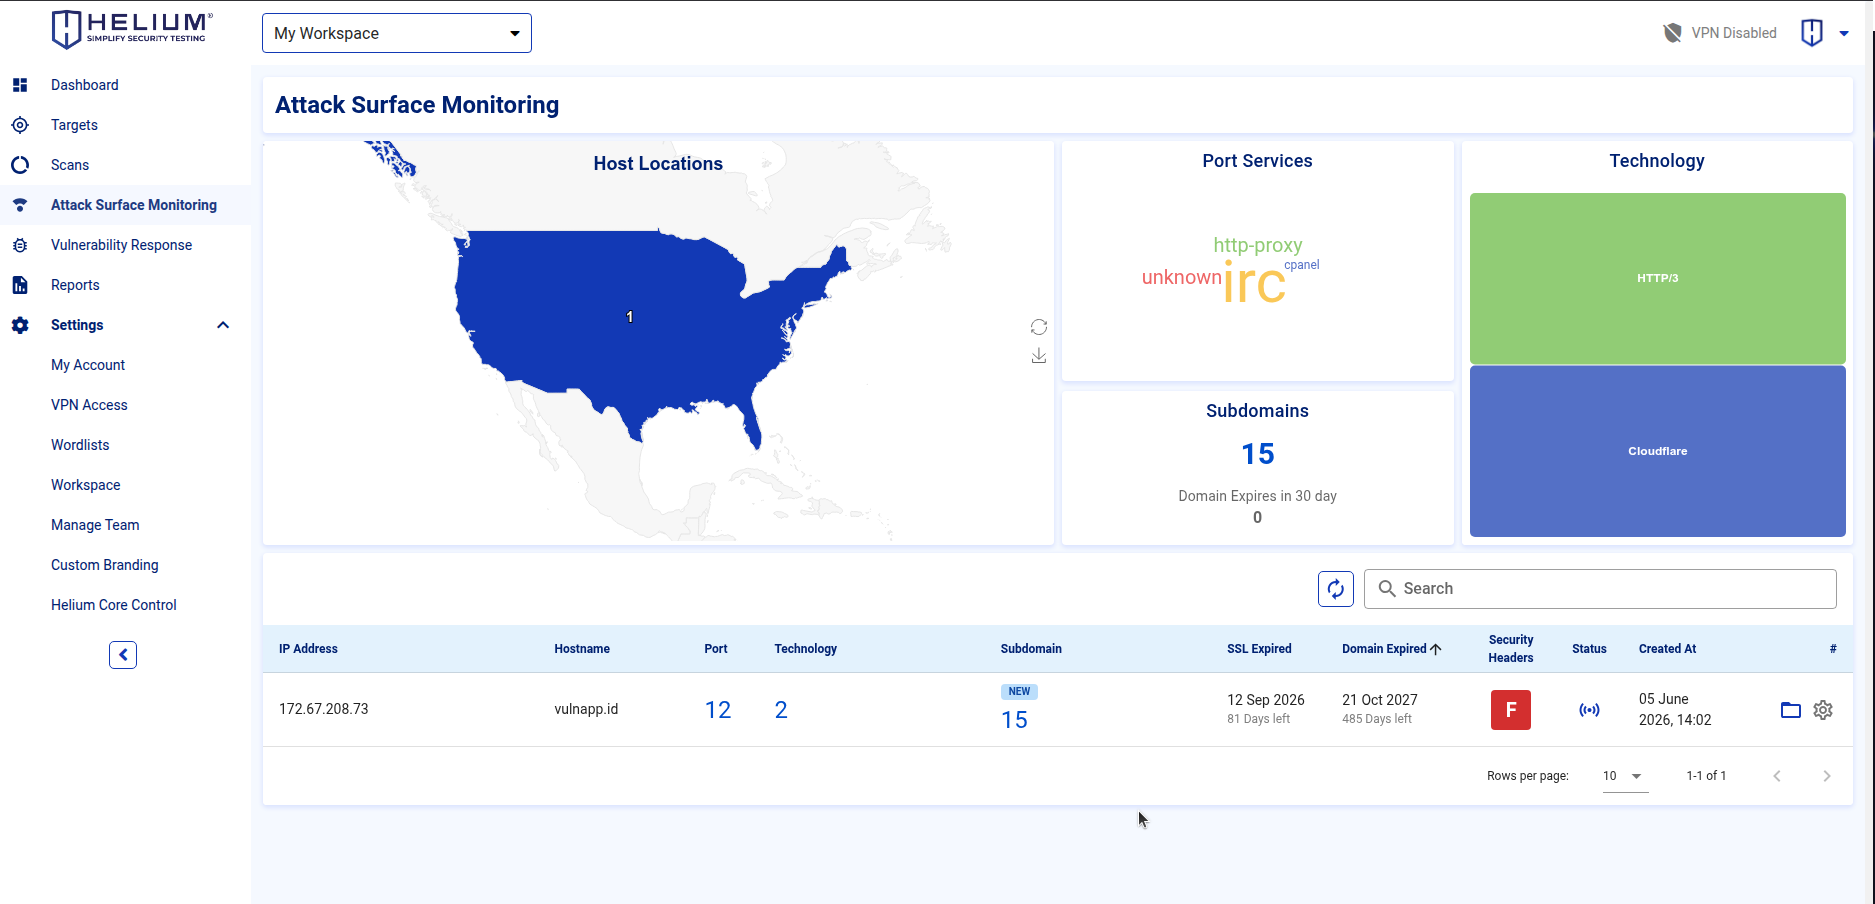 The dashboard provides an overview of detected assets and their security posture. It includes
- Host Locations: A world map highlighting where hosts are located
- Port Services: A circular chart showing open service ports (e.g., HTTP, SSH, SMTP)
- Technology: A word cloud displaying detected technologies (e.g., Nginx, Ubuntu, Bootstrap)
- Subdomains: A section indicating that no subdomain data is currently available
- Asset Table: Lists details such as IP address, hostname, number of open ports, technologies used, SSL and domain expiration dates, and security header grades
This interface helps users monitor their external attack surface, detect exposed services, and manage potential vulnerabilities.
Click the status icon to view the monitoring schedule, and click the gear icon to start or stop monitoring.

You can view more information by clicking the Details button.
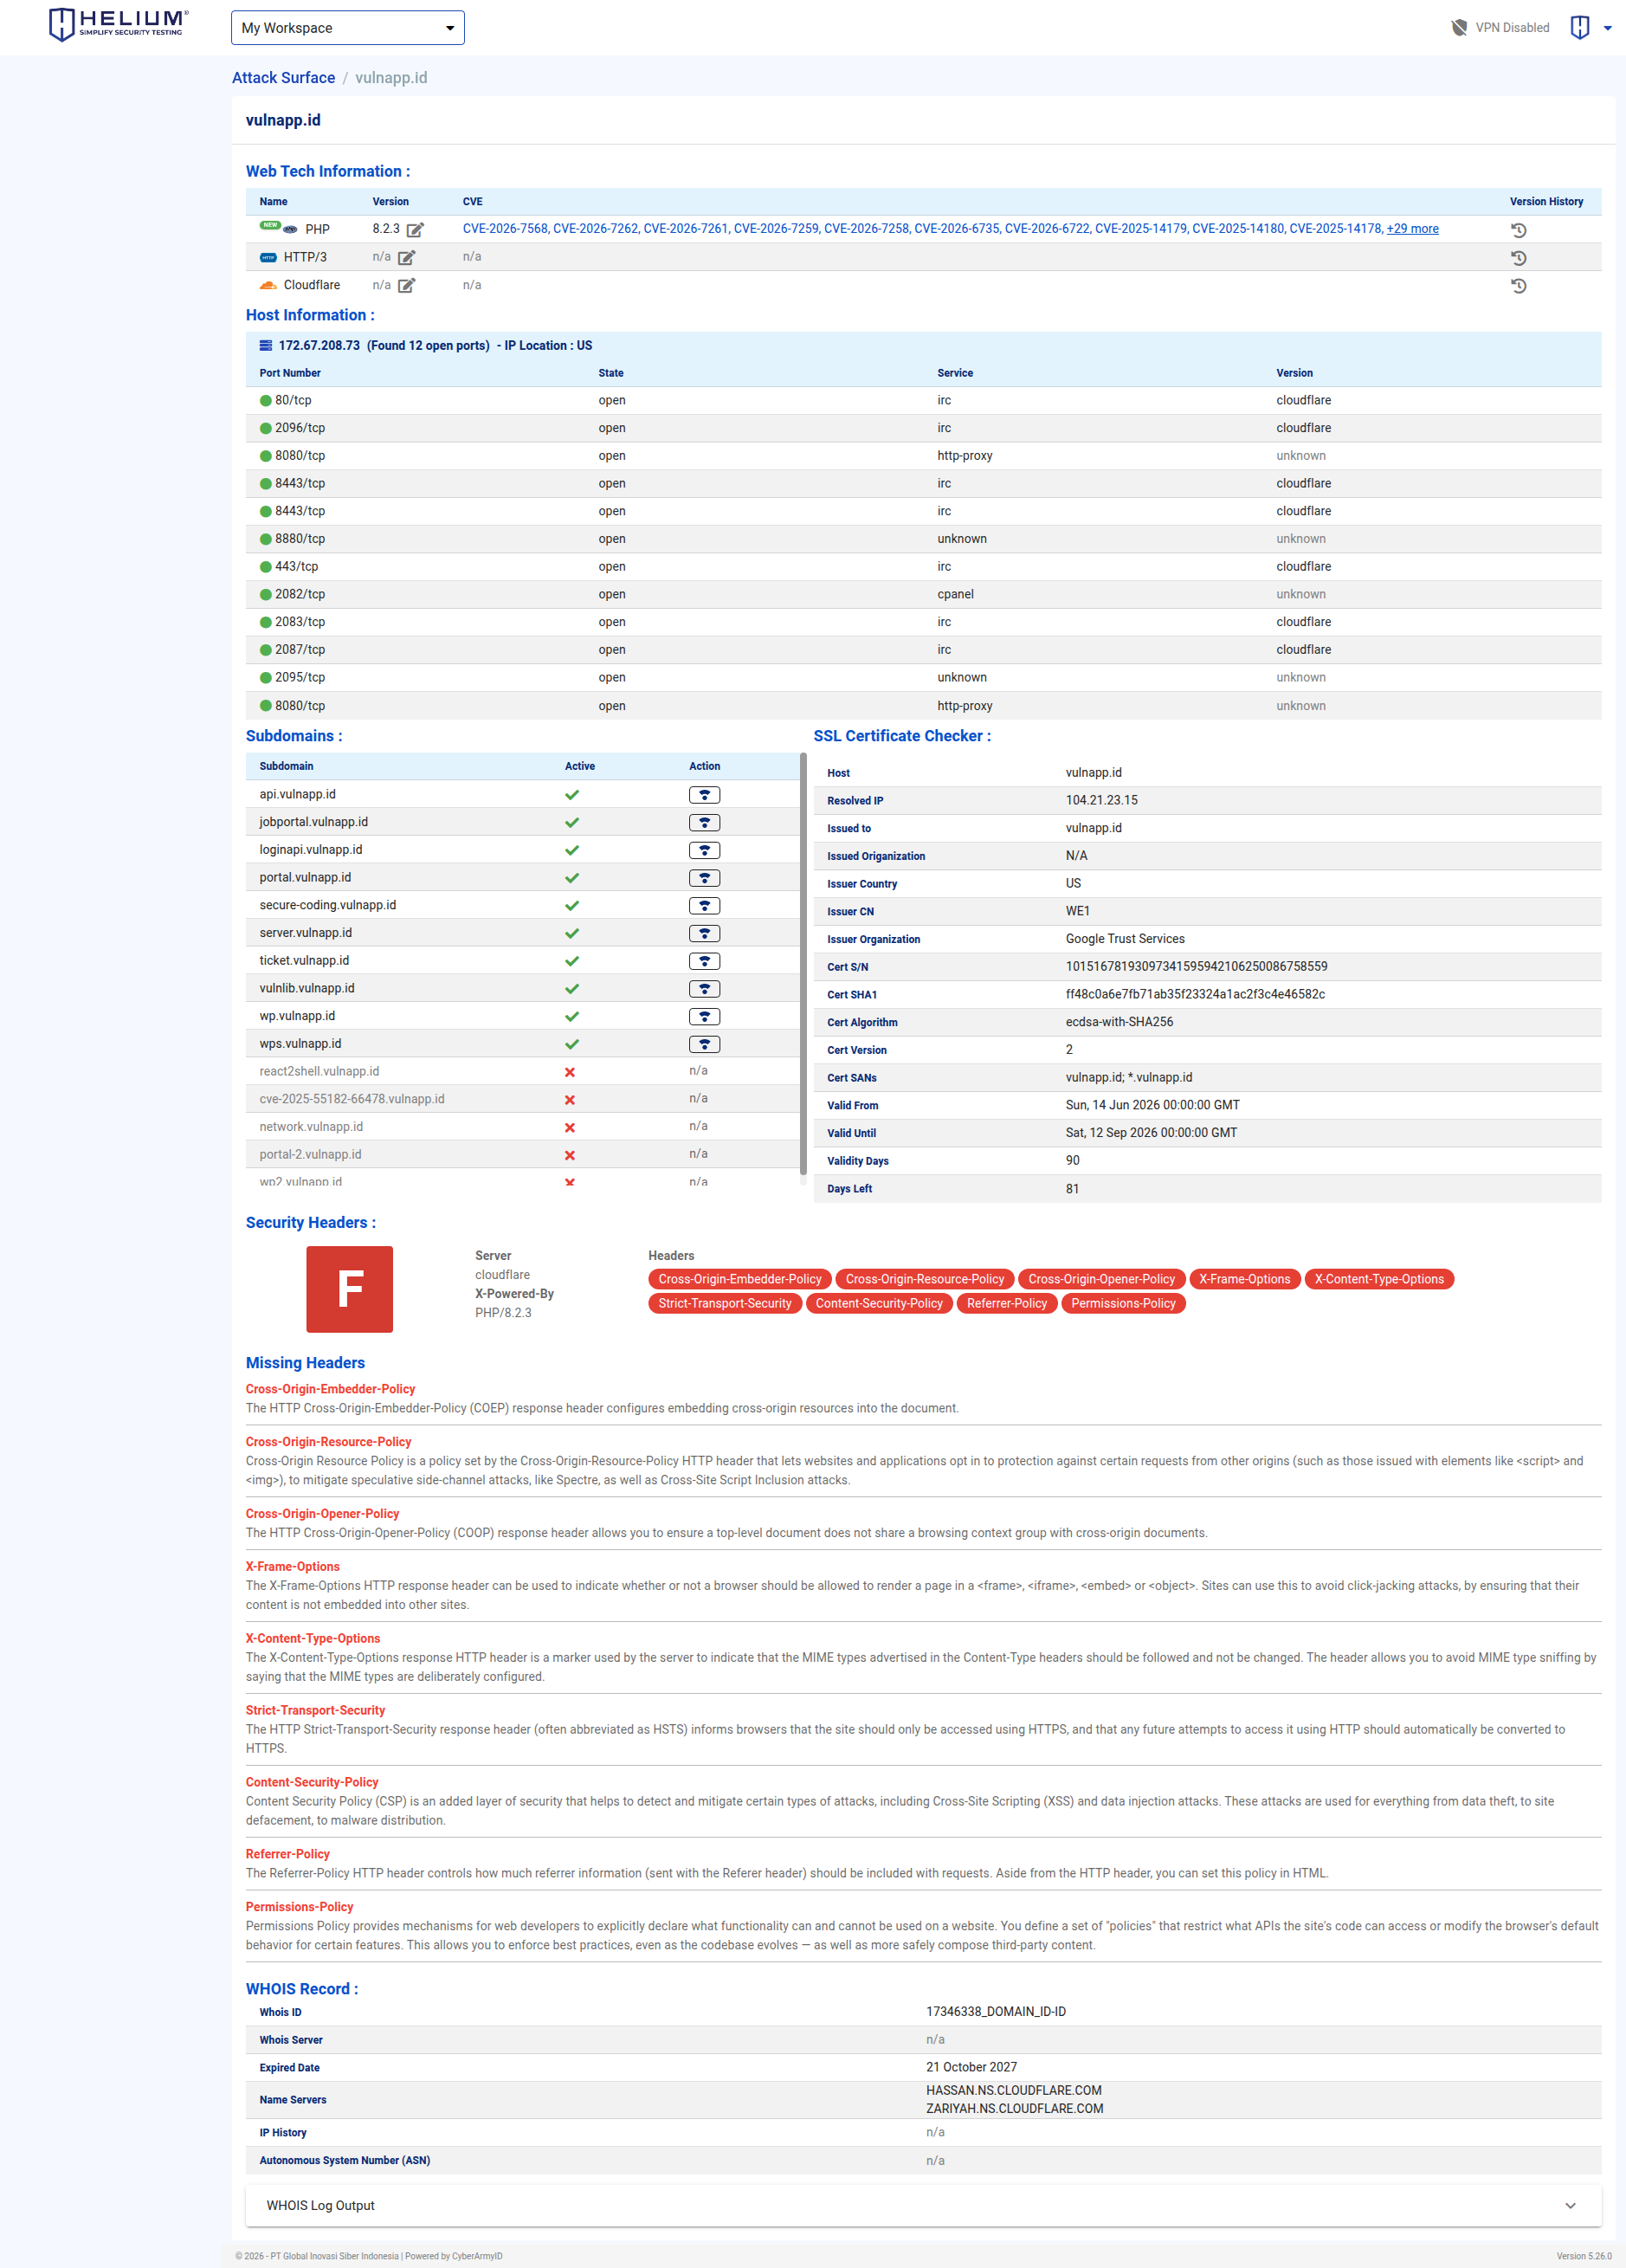
Web Tech Information : Lists detected technologies and their versions (e.g., web server, CDN, HTTP/3, PHP, Vue) used by the target, along with the corresponding CVE information for those technology versions.
note- You can modify the technology version by clicking the edit icon in the version column.
- You will also receive detailed CVE information based on the specific version of that technology. :::
Host Information : Shows resolved IP(s), open ports, and services with their operational state and detected service versions.
Subdomains : Enumerates discovered subdomains for the target domain (useful for expanded attack-surface mapping).
noteYou can perform attack surface monitoring on a specific subdomain by clicking the Action icon.
SSL Certificate Checker : Summarizes certificate details, including SANs, issuer, validity period, fingerprint, and algorithm.
Security Headers : Lists missing or present HTTP security headers and their status/values (such as CSP, HSTS, X-Frame-Options, etc.).
WHOIS Record : Displays domain registration metadata, including registrar, creation/expiry dates, name servers, and contact information.